I wish to graphically visualize how large blocks of IP addresses are utilized by their network operator, and gain some insight into network “areas” with latency or possibly network health issues. This 2D ping latency heat map, relies upon a way to quickly ping a large range of IPs. In another POST, I provided a fast, highly concurrent icmp ping python application, for quickly pinging large IP blocks. I use an AWS US-WEST-2 EC2 server to ping the IP blocks below, and create the 2D ping latency heat maps.
The python visualization code is here , in GITHUB.
If one thinks about consecutive IP addresses, as being “close” to each other; I’d like to map a block of sequential IPs, such that consecutive IPs would be contiguously grouped “closely” into a new x-y cartesian space. In 2006 the XKCD webcomic first mapped the IPv4 internet to a 2D space, using hilbert curve fractal mapping.
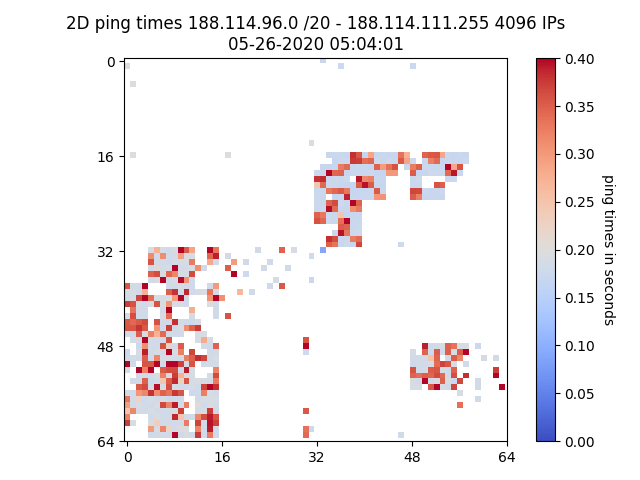
The following IP heat map is a ping latency visualization, are for the 188.114.96.0/20 network. All 4096 IPs in this network, are either unpingable and marked as white space, or their ping latency times are in a range of colors. The faster ping times are dark blue in color, and ping times greater than 350 milliseconds are brighter red. The tick marks are in increments of 16 and a 16×16 area is a /24 subnet.
A single .png file, 2D ping latency heat map
This view might let you know; not much of the /20 subnet is pingable, or in-use. This snapshot of ping latency times, taken at 05-26-2020 05:04:01 UTC, was likely during a period of high network usage.
An animated GIF view, of multiple 2D ping latency heat map snapshots
The following GIF is an animation of 82 hourly ping latency png file snapshots. It appears there are 1-3 hourly periods during the day, where groupings of ping latency times jump from ~ 170 msec to ~400 msec . Ping times can be a proxy for network capacity. This view could suggest; network links / routers supporting groups of servers, are heavily loaded during peak usage times. Ping times are often a reflection of how-busy each router’s control plane is, or if the router control plane provides resources to icmp functionality. This post references a BFD protocol parser, that may provide better data insights into network link capacity via BFD timing.
The following is a gallery of interesting CDN server subnets:
I would also like to reference, a few other IP mapping efforts …
- Open source Python mapping code I borrowed. Thank you Professor John Burkardt
- Antonios Chariton @DaknObCS and his mapping of 36C3
- Ben Cox @Benjojo12 tweets and blog posts, initially got me jazzed about BGP things & IP mapping references.
- The ANT team and their internet mapping work